New Algorithm Designs Smarter Materials
Designing smarter materials, one click at a time, is becoming a reality for scientists at Hokkaido University who have released a new web-based tool for visualizing catalyst data. The platform aims to make complex materials research more accessible by allowing researchers to analyze catalysts without needing advanced programming skills. By bridging the gap between raw data and real-world experimentation, the system empowers a broader range of scientists to engage with materials science data effectively.
Translating Chemical Data Into Visual Sequences
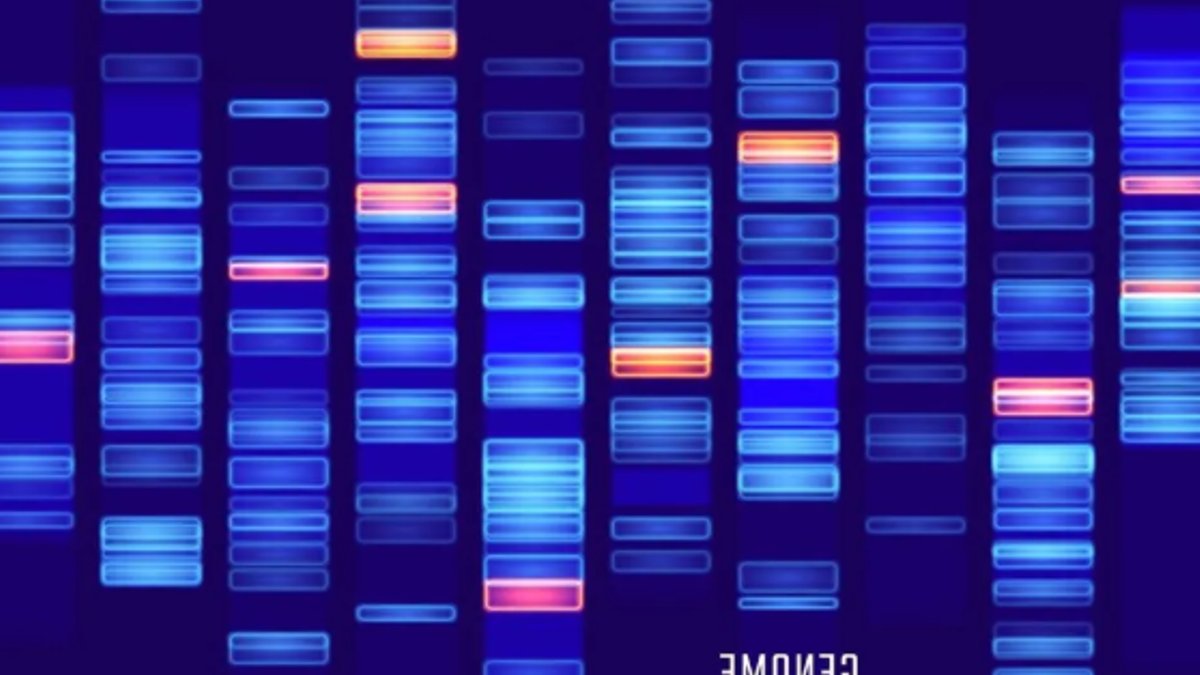
Catalyst performance relies on many interconnected variables, making it difficult to find meaningful patterns. The researchers behind the new system use a method called catalyst gene profiling. In this approach, catalysts are expressed as symbolic sequences, similar to genetic code. By translating material properties into these sequence-based representations, scientists can more easily compare catalysts and spot trends.
This method transforms abstract chemical properties into tangible symbols, allowing for a standardized way to represent diverse materials. The resulting profiles serve as a unique identifier for specific catalysts, enabling the software to process vast amounts of information efficiently. The process moves beyond simple data entry by creating a visual language that connects the dots between molecular structure and functional output.
The web-based graphical interface lets users interact with these profiles visually. It bridges the gap between raw data and real-world experimentation by showing relationships among catalysts and the underlying features driving their performance. Professor Keisuke Takahashi, who led the study, noted that the system enables researchers to identify global trends and local features without advanced coding. The platform effectively lowers the barrier to entry, allowing experts in chemistry and materials science to utilize high-level data analysis tools without writing a single line of code.
Related: BlizzCon 2026 Announces Expanded Esports Lineup
Interactive Exploration of Material Properties
Users can view catalysts clustered by similarity based on their physical features or gene-like sequences. A synchronized heat map reveals how those gene sequences are calculated, offering insight into what drives performance differences. The design focuses on fluid interaction, allowing multiple visualizations to be viewed side by side. This side-by-side comparison capability is key for understanding the nuances of catalyst behavior across different conditions.
When a user zooms in or selects a specific group, all views update simultaneously. This dynamic feedback loop ensures that researchers can drill down into specific data points without losing context. The interface handles large datasets with ease, maintaining performance even when dealing with complex interactions between various material properties. By synchronizing these visual elements, the tool provides a full view of the data setting.
While the current iteration focuses on catalysts, the research team plans to adapt the platform for other materials science datasets. Future versions may include predictive features, allowing researchers to test new concepts and design next-generation materials. The team also intends to enhance shared annotation and multi-user exploration features to support community-driven research. These future enhancements aim to support a collaborative environment where insights can be shared and refined collectively.


